CIBC Investment Tool
Project Details
This tool was designed for financial advisers to illustrate future retirement & investment projections for their clients.
How it works
- Commissioned by CIBC, the tool has multiple stages for calculating financial projections based on age, retire age, savings amount, contribution amount, and other factors.
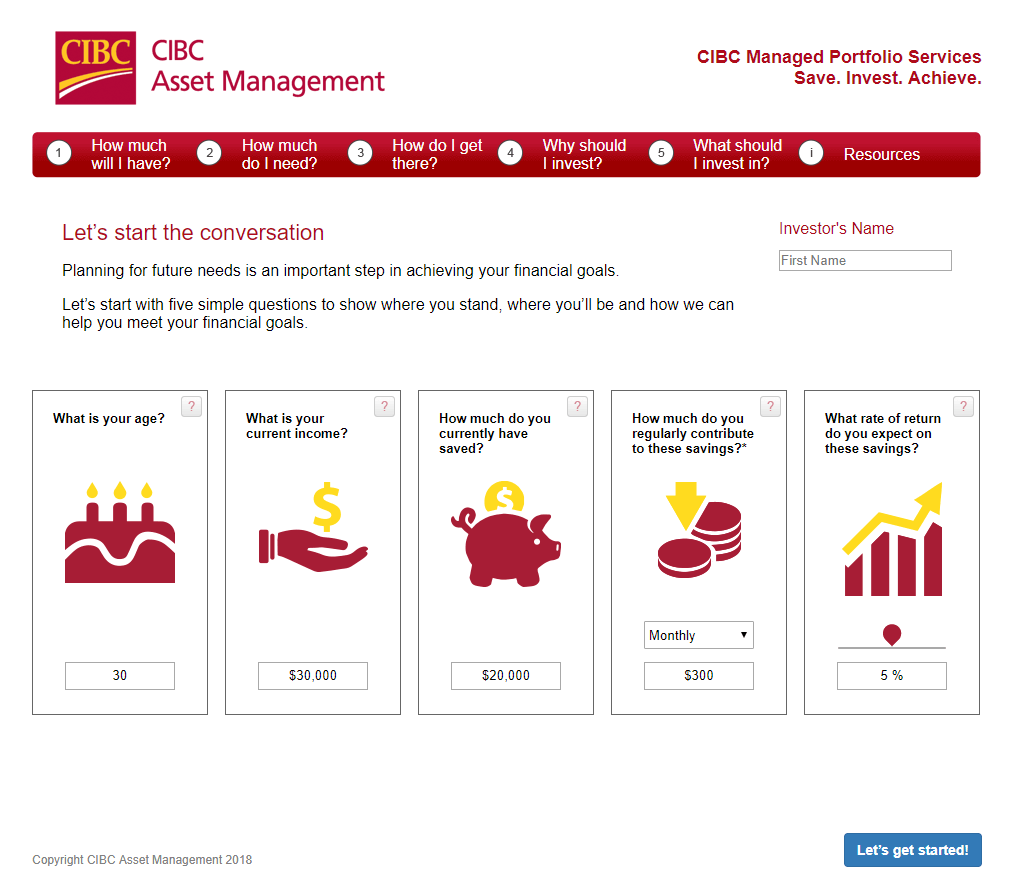
Stage 0:
- User enters basic inputs about themselves
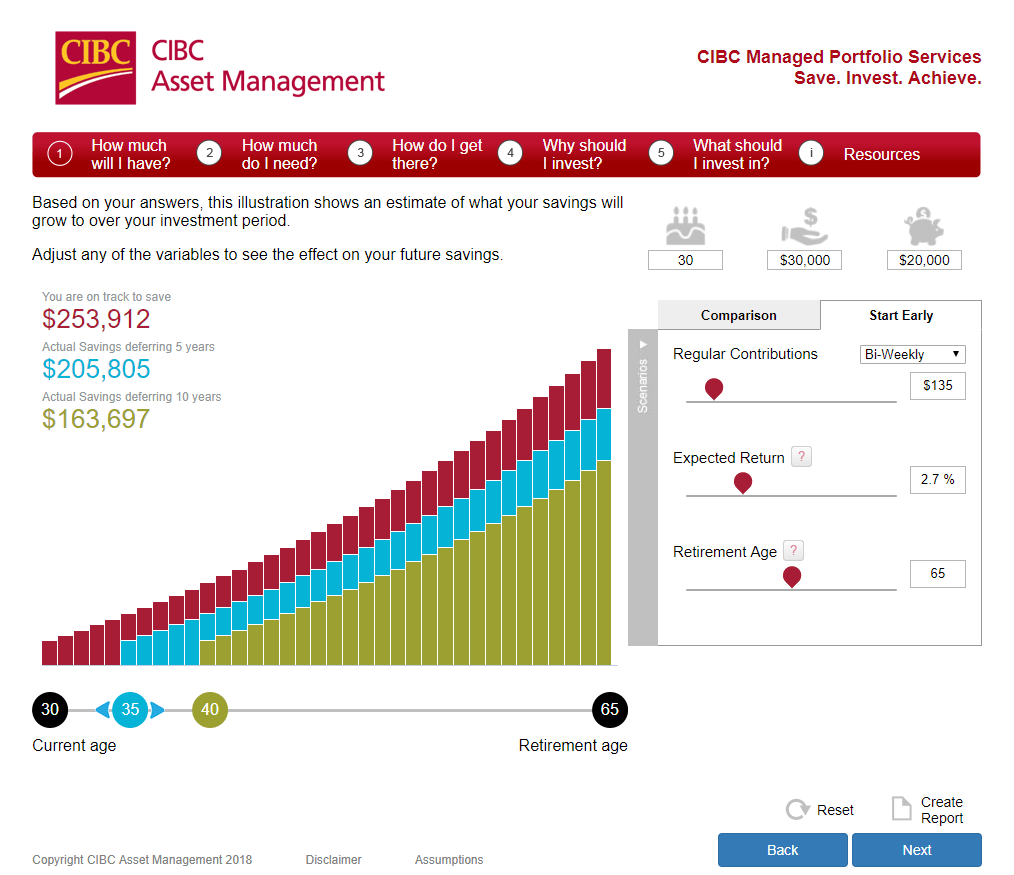
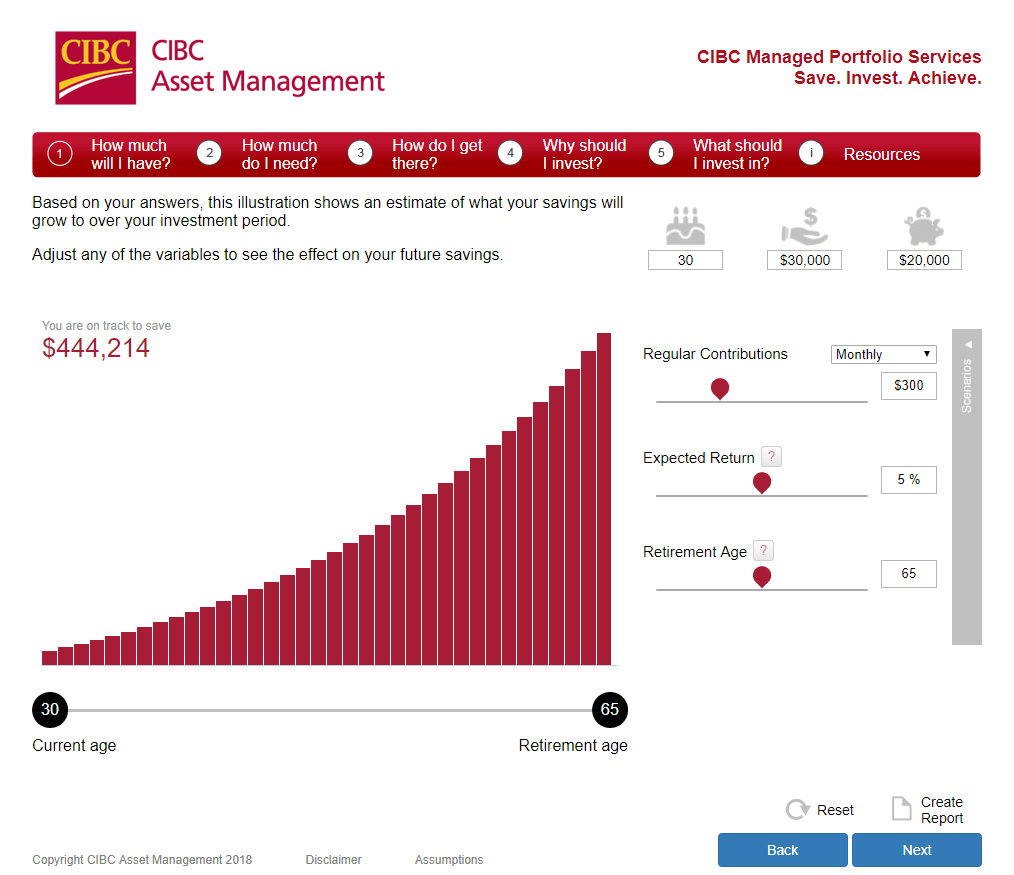
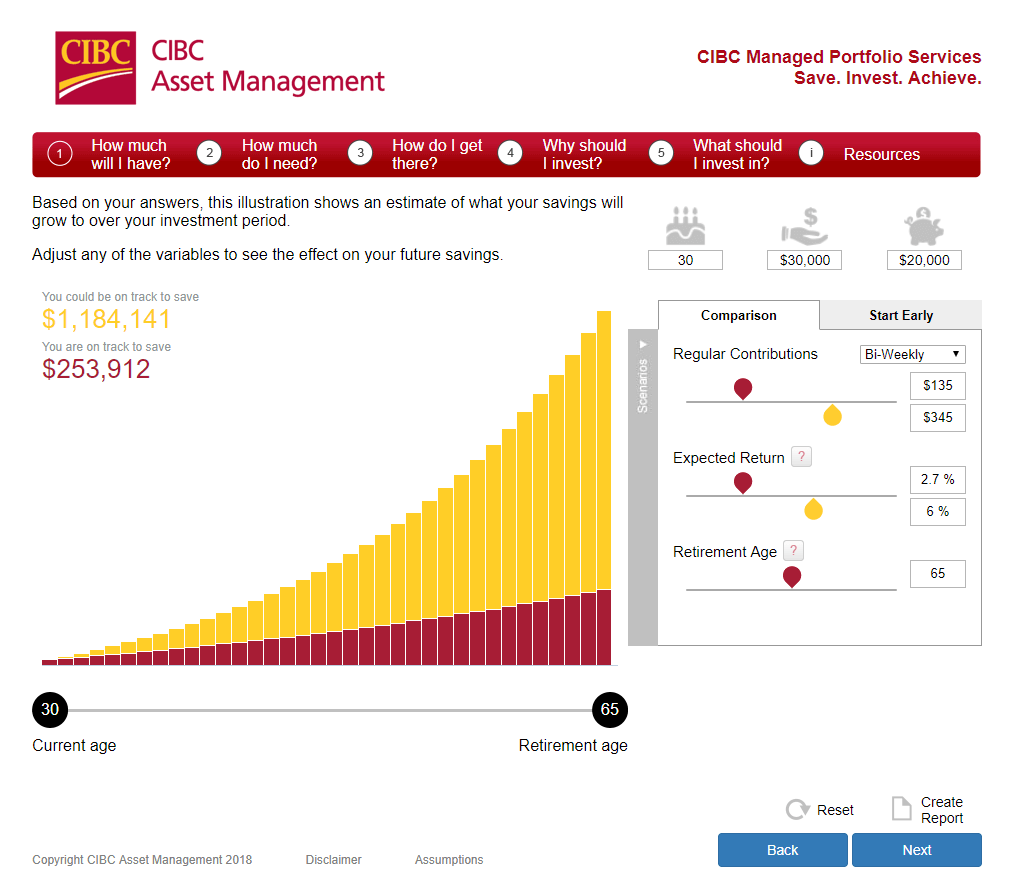
Stage 1:
- Shows projected investment amount based on the inputs of last stage. Graph is interactive and you can adjust the original values to see how it changes. It also has a comparison graph, as well as graph for starting investment 5, 10 years earlier – all showing how much you’d save by retirement.
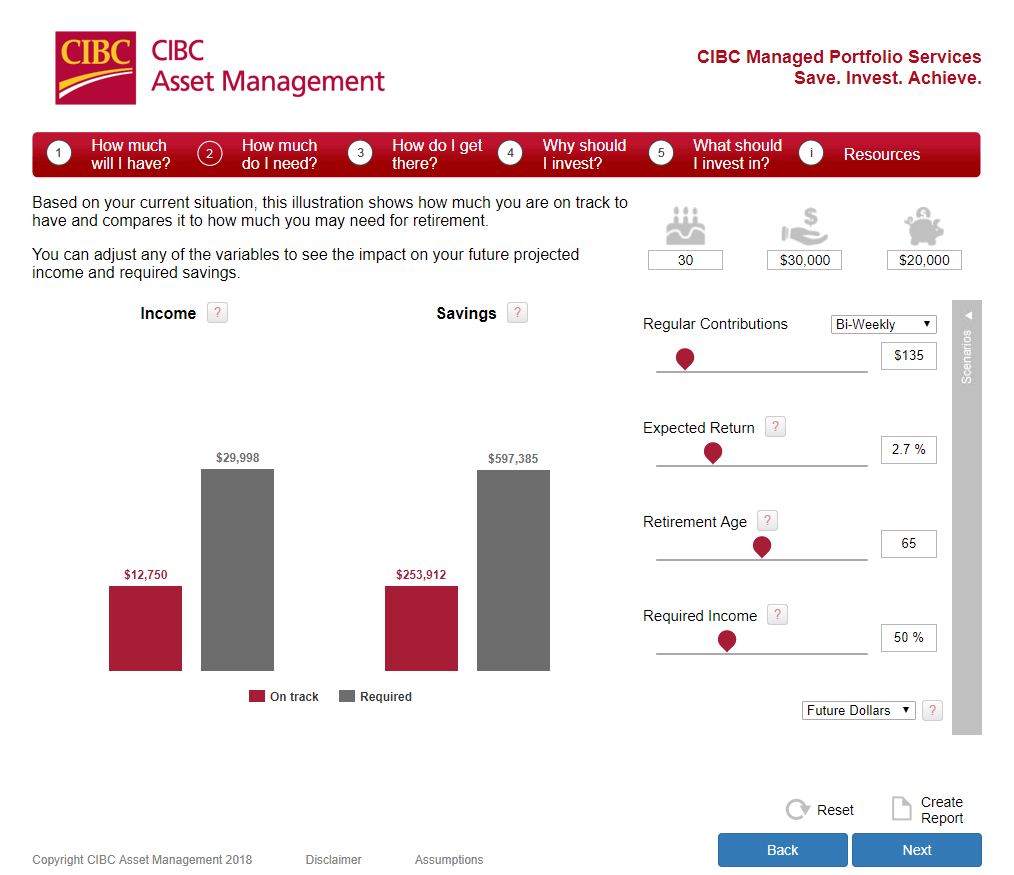
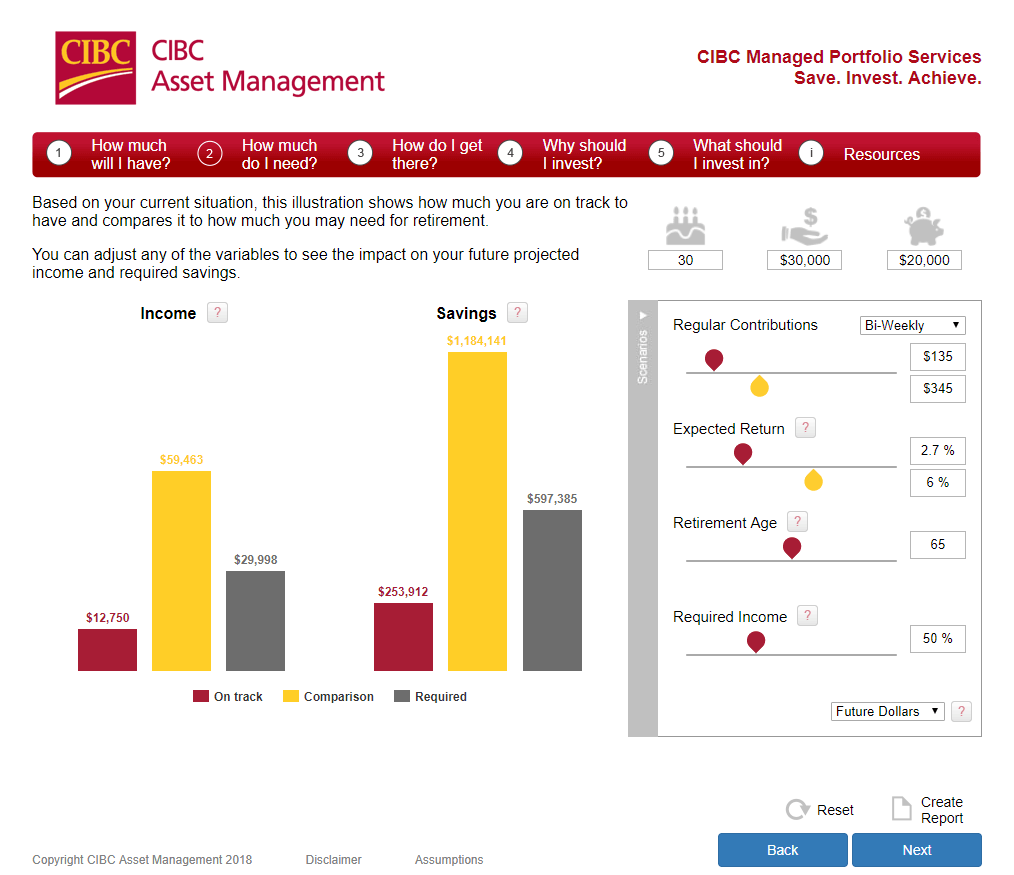
Stage 2:
- Stage two shows required incomes and savings you would need after retiring based on your spending rate. You can also make comparisons here, as well as view the chart in current or future dollars.
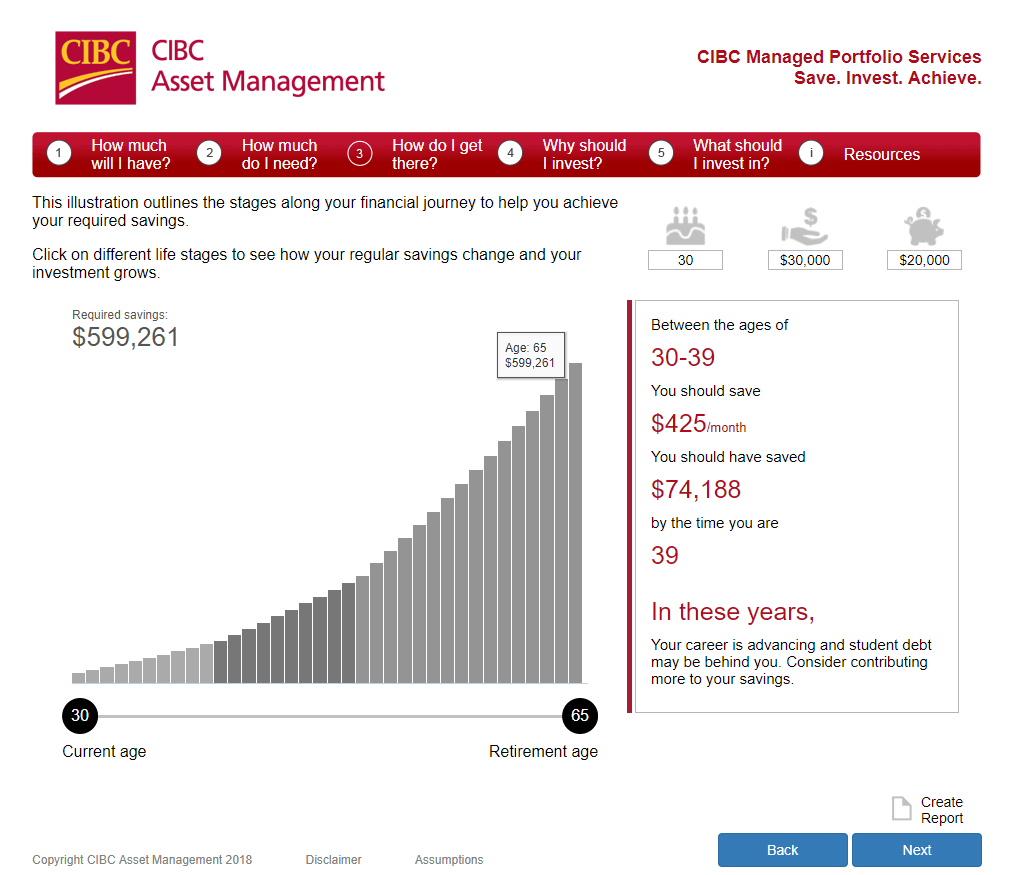
Stage 3:
- Stage three shows how much you should realistically save per month to get to your goals. It shows recommendations based on the age group you are in.
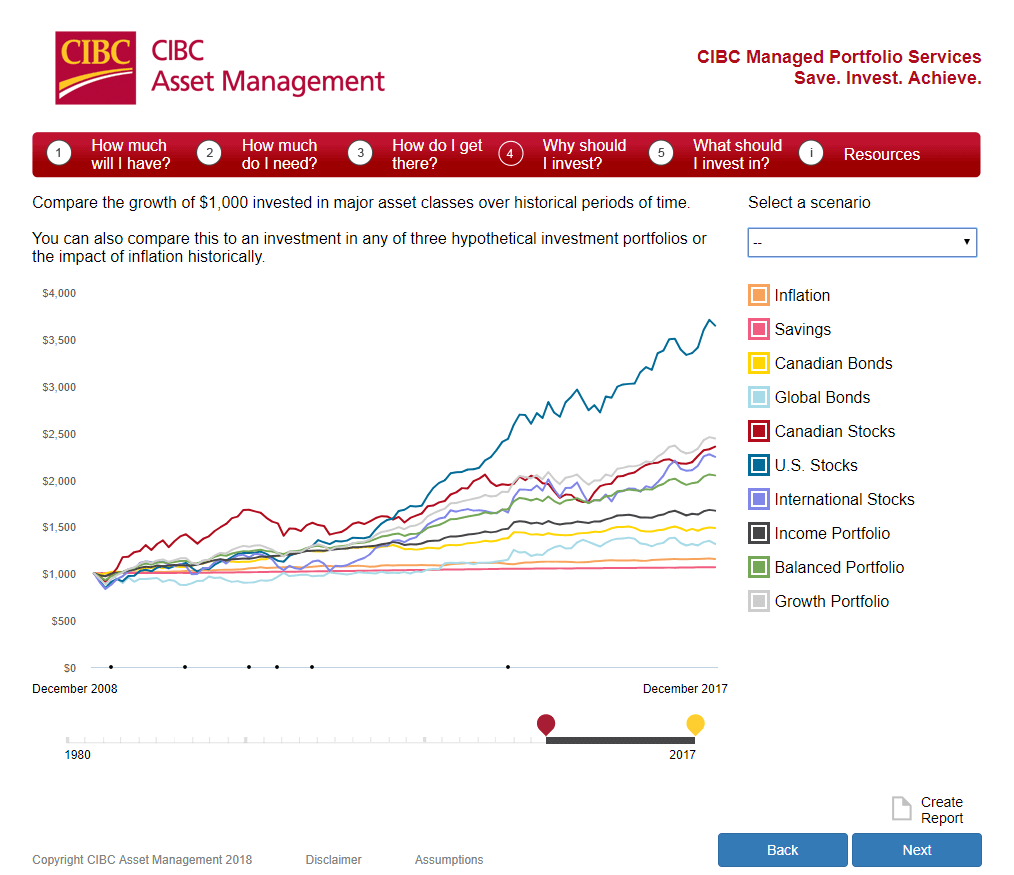
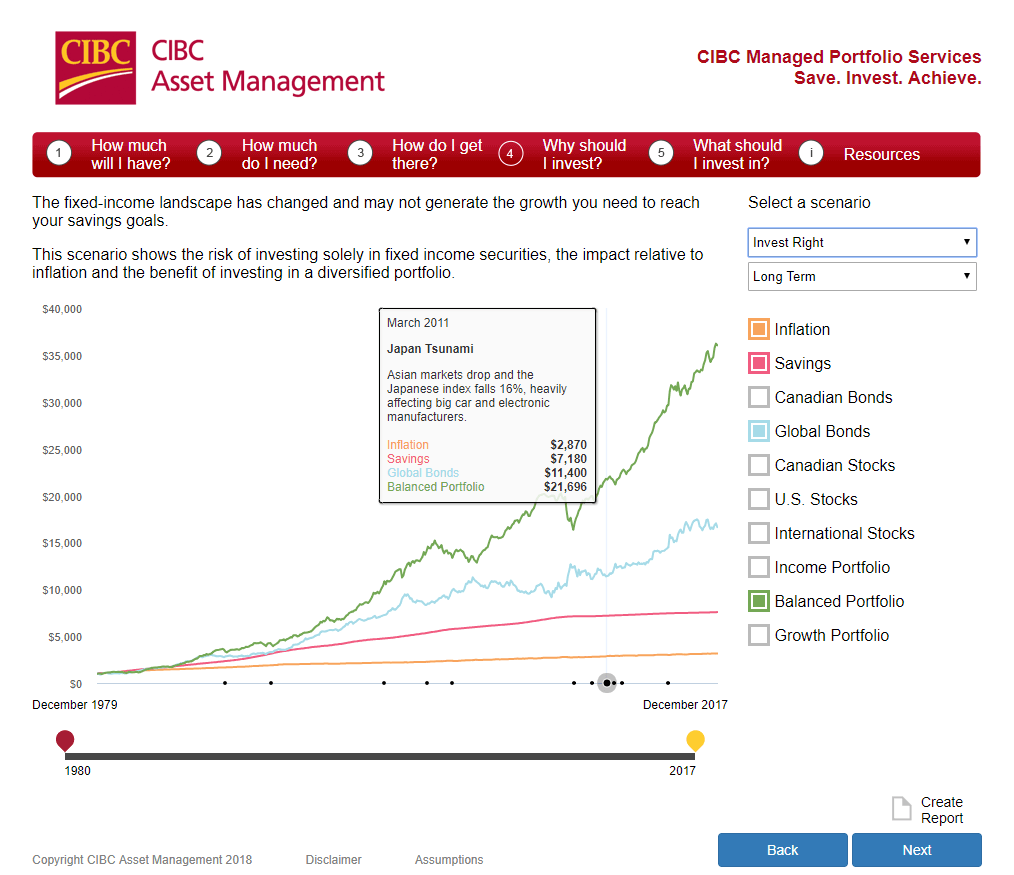
Stage 4:
- Stage four shows the investment growth trend over the last 40 years. You can choose different scenarios and portfolios and despite various economic events. Over the long term, most depict growing return of investment.
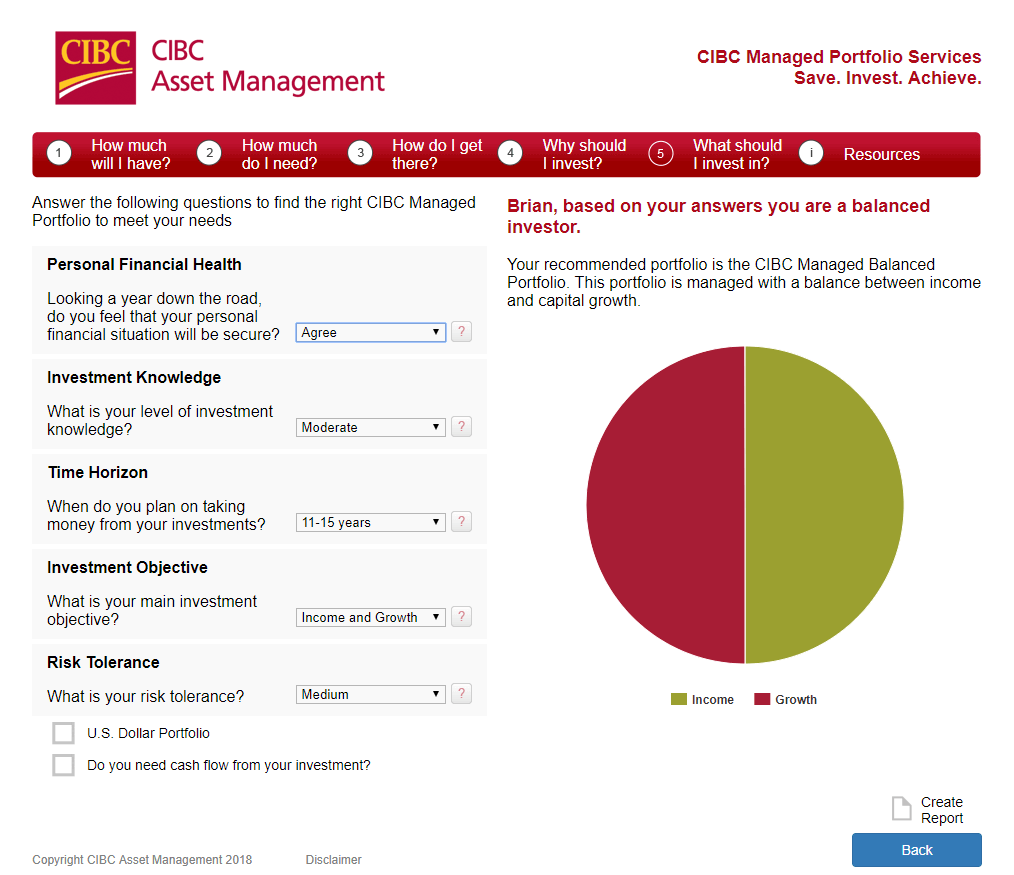
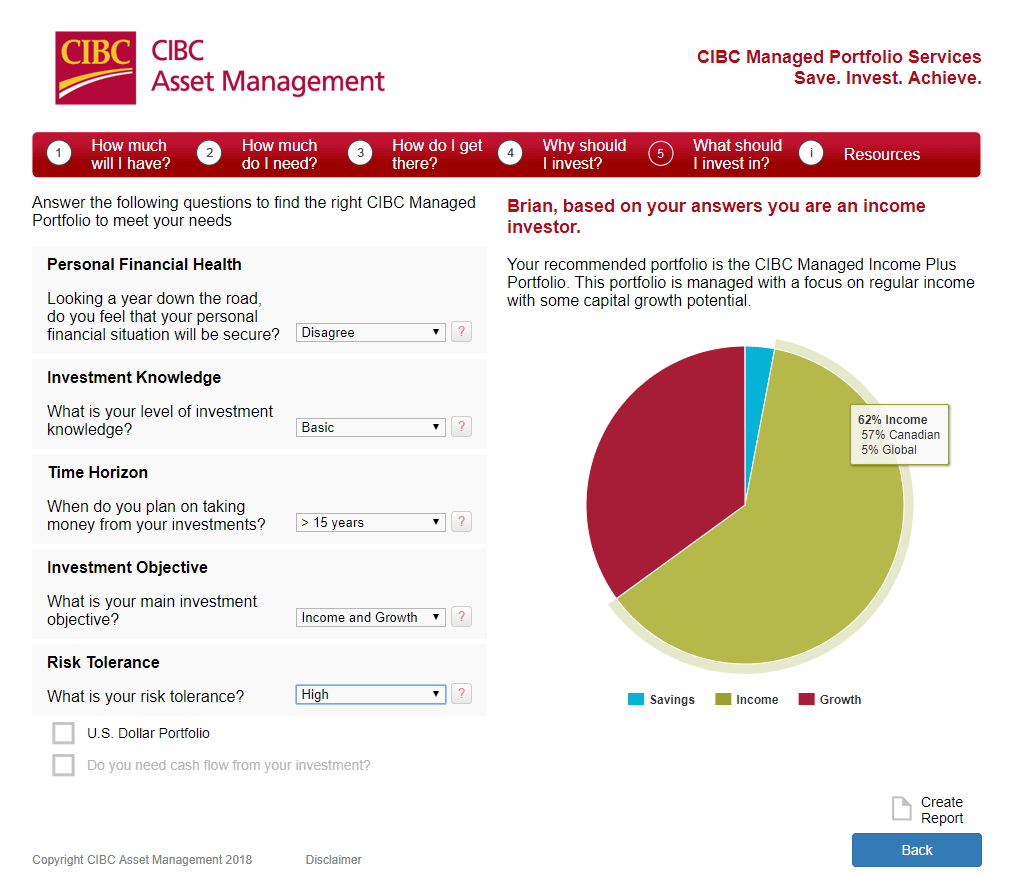
Stage 5:
- Stage five helps to balance your investment portfolio based on your time horizon, investment knowledge, risk tolerance and other factors.
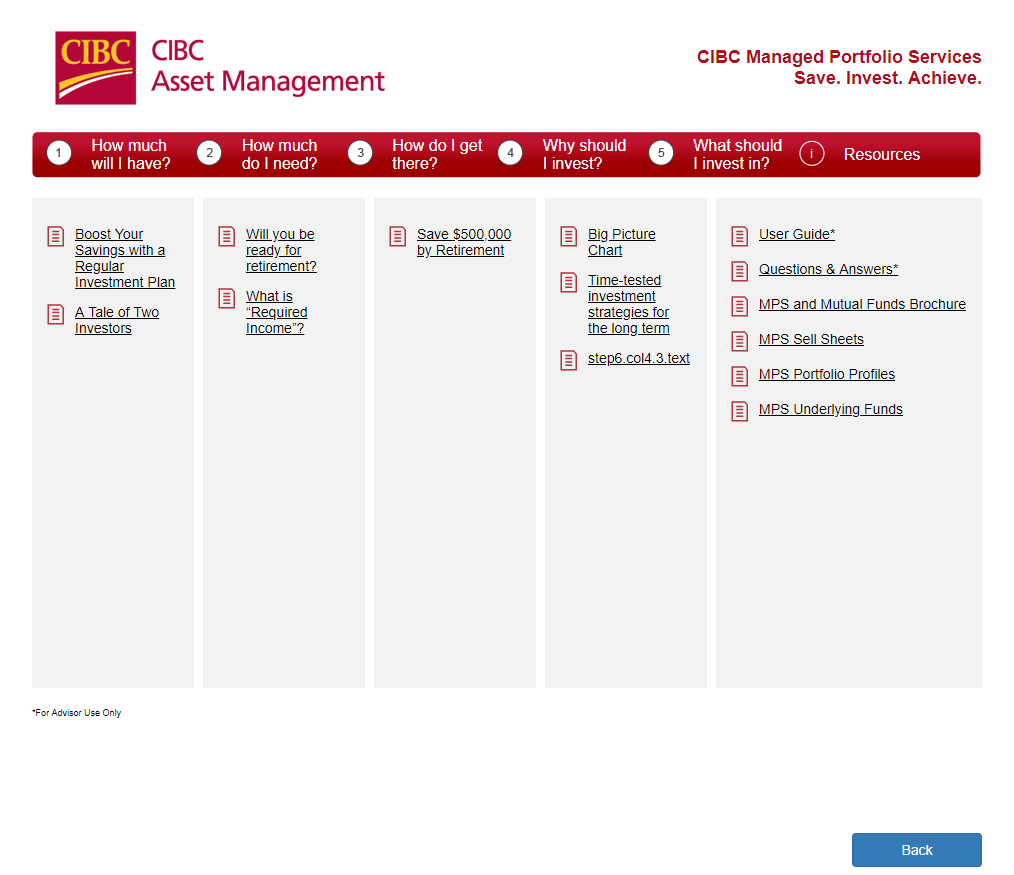
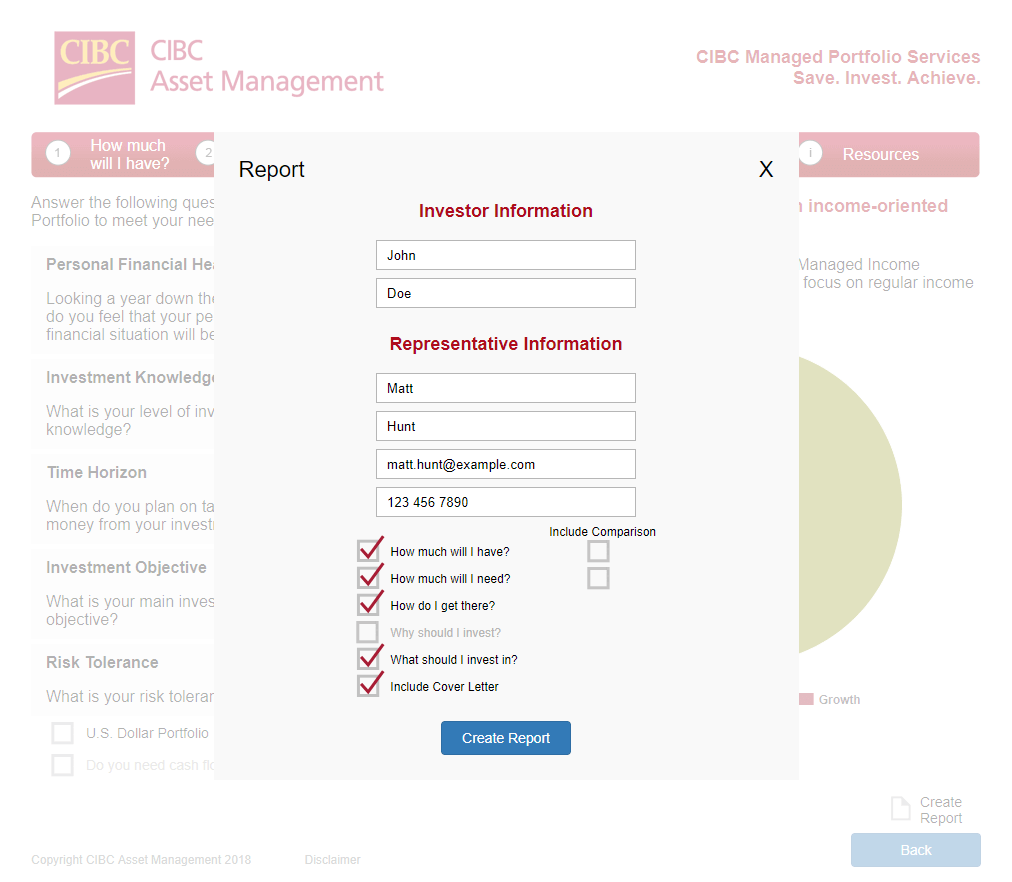
Generate Report:
- After the financial adviser goes through the tool with his/her client, they can create PDF report of all the graphs generated and email it. There is also a resources page if an adviser needs to refer to more information.

Features & Components
- Legacy browser and cross browser support (chrome/firefox/safari) so the tool can be used in most banking environments.
- Fully Legal compliant text on every page, and label.
- Bilingual options to provide both English and French versions, including images, text, chart labels and others.
- Accessibility standard compliant (WCAG 2.0) to work for the visually disabled.
- PDF creator that saves charts generated as you proceed through the tool.
- Various interactive graphs from Stage 1-5 that you can play with and change.
Challenges & Other Comments
- This was a major project spanning several months of team effort and included a few challenges:
- First we had to find a good library to use for all the various charts. We played with a few libraries and ended up settling with Highcharts. It was easy to implement, fast, and flexible.
- To build the calculator scripts, we had to follow the excel sheets vetted by the client. We built a demo site to check if our various math functions were outputting the same values as the excel model.